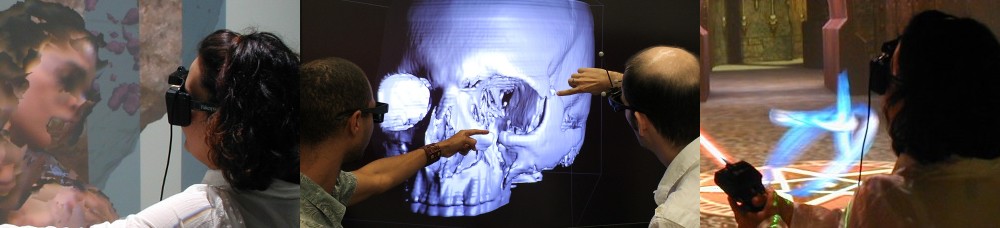
Now that Vrui is working on the HTC Vive (at least until the next SteamVR update breaks ABI again), I can finally go back and give Vrui-based applications some tender loving care. First up is 3D Visualizer, an application to visualize and, more importantly, visually analyze three-dimensional volumetric data sets (see Figure 1).
Figure 1: Analyzing a CAT scan with 3D Visualizer on the HTC Vive. Cat included.
Mathematically speaking, a volumetric data set is a discretized function F(p) where p = (x, y, z) is some point in 3D space and F is some function value, e.g., a scalar such as temperature or density, or a 3D vector such as velocity. “Discretized” means that, while the function F can in theory be evaluated for any point p inside the data set’s boundaries, a data set only stores function values for a finite set of points pi = (xi, yi, zi) and prescribes some way of interpolating function values between those points. The set of pi typically forms some type of regular or irregular grid, where the pi, the so-called “vertices,” are connected by so-called “cells.” In the common case where all cells are cubes or boxes of identical shape and size, a volumetric data set is the 3D analog of a digital image, which is a 2D grid of vertices (now called “pixels”) having scalar (greyscale) or vector (RGB) values.
Back in the concrete realm, a CAT scan like the one shown in Figure 1 is based on the simplest type of regular grid mentioned above. A CAT scanner actually produces a set of 2D greyscale images (“slices”), which can be stacked on top of each other like a deck of cards. This stack is then the discretized function F(p). The data values in CAT scans are rates of X-ray absorption, which correspond somewhat directly to tissue densities (air does not absorb X-rays; soft tissue absorbs a little, bones absorb more, metal implants or fillings absorb almost all).
In our usual applications in Earth science, grids are typically a bit more complex, often being spherical to represent the interior of the Earth (see Figure 2), or consisting of multiple tiles joined together at the seams (see Figure 3), or even containing multiple resolutions.
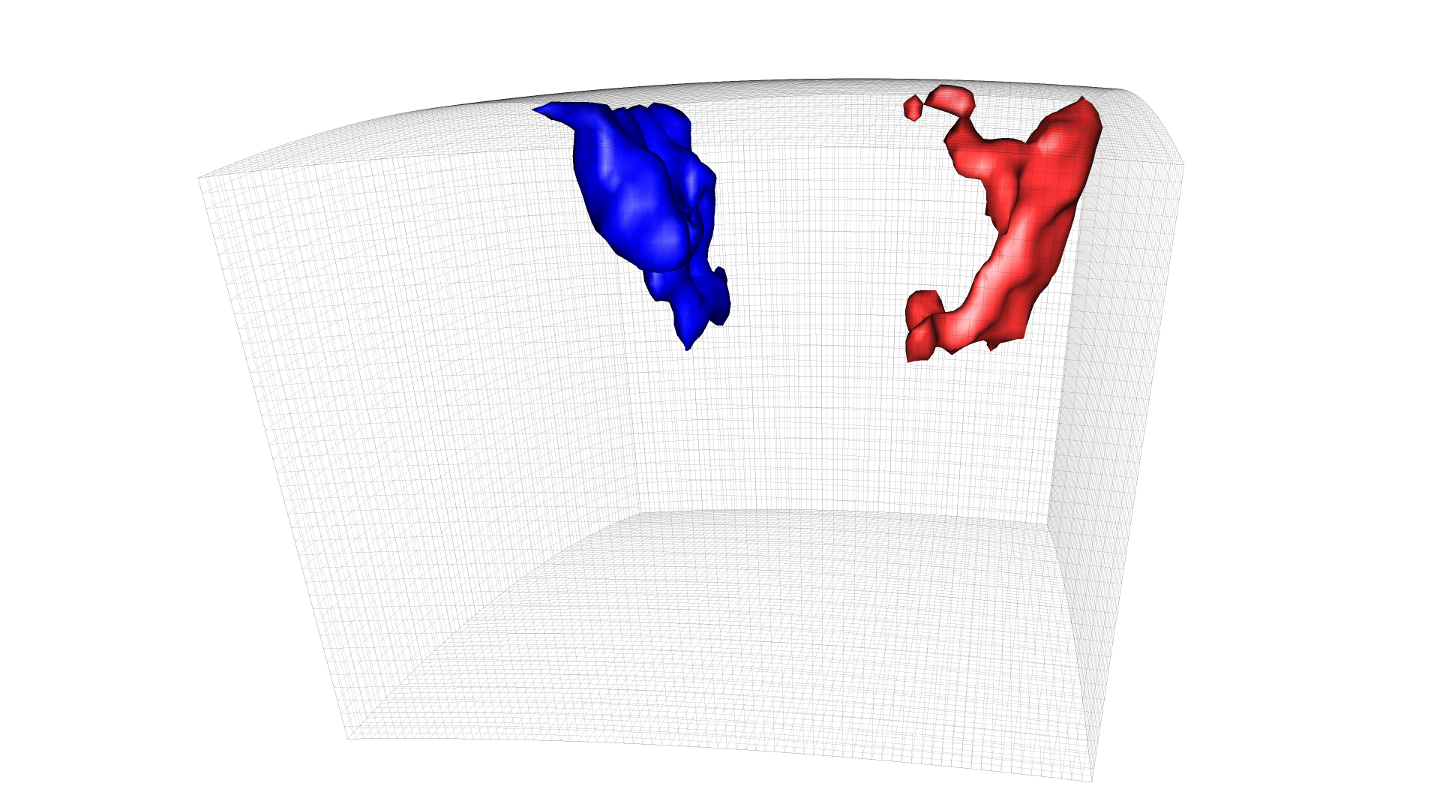
Figure 2: Structure of Earth’s mantle underneath the western US (surface on top, west towards the left). The blue isosurface indicates a subducting slab, and the red isosurface is the magma chamber underneath Yellowstone National Park. Seismic tomography data provided by Richard Allen, UC Berkeley Seismolab.
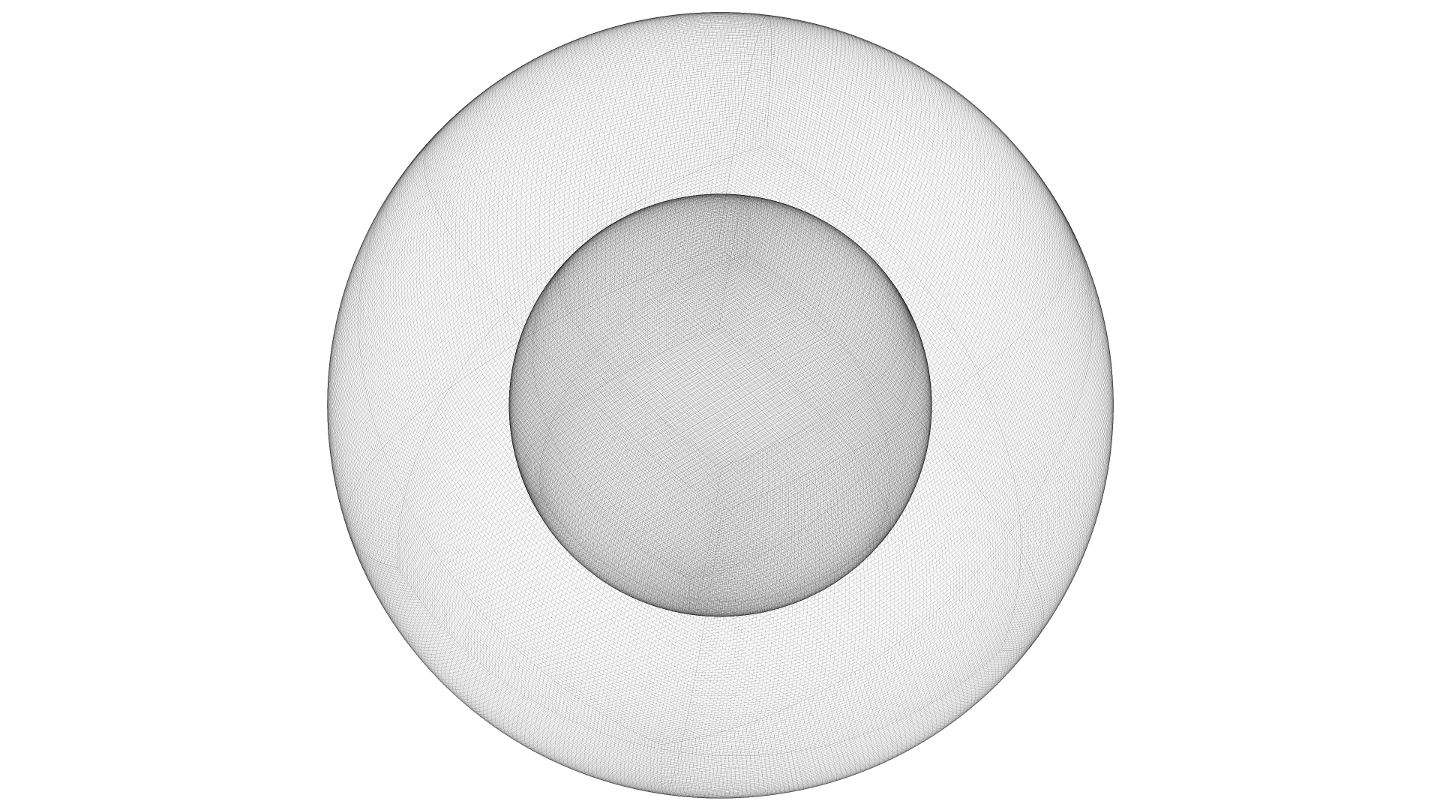
Figure 3: Tiled grid representing the Earth’s mantle as 12 joined regular spherical grid “caps.”
The nice thing about 3D Visualizer is that it does not care much about different grid structures, or the types of data values contained in them. It is split into two levels: the lower level stores concrete grids and data values and represents them to the upper level as abstract functions F(p), and the upper level contains visualization algorithms that let users extract visual representations of those functions in real time, using a rather efficient implementation based on C++’s template mechanism. As a result, users can apply the same set of algorithms, using the same user interface, to any type of data set supported by 3D Visualizer. For the curious, 3D Visualizer’s architecture is described in detail in this old paper from 2002 (it’s quite amazing how the description of VR methods and interaction techniques from back then matches what’s commercially available today).
The visualization algorithms provided by 3D Visualizer are relatively simple, but powerful. The simplest one, evaluating the abstract function F(p) at any position p, is boring but useful, and the next one up are planar slices or cross sections colored by data values. Essentially, these slices are 2D images, but extracted at arbitrary positions and orientations. Then there are so-called “isosurfaces,” non-planar surfaces that connect points in the data set having the same function value F(p) = c. Isosurfaces are a 3D analog of contour lines (curves of equal elevation) on topographic maps.
The core user experience feature of 3D Visualizer, and the one that makes it work so well in VR, is that the fundamental visualization algorithms are based on direct manipulation. To create a slice in a “standard” visualization package, the user might have to enter a 3D position and/or slice orientation into a set of text fields, or manipulate some 3D widget with a mouse. To create an isosurface, the user would typically enter the so-called “isovalue” c into a text field, and then wait for a few seconds for the surface F(p) = c to be extracted. In 3D Visualizer in VR, on the other hand, users can reach into the data set with a tracked controller, press a button, and immediately extract a slice at the controller’s position and orientation, or an isosurface for the value F(p) where p is the controller’s position. Results of these extractions, so-called “visualization primitives,” are presented in real time, with the default extraction latency being 100ms (note that extraction latency is independent of display latency, which is determined by the VR display hardware, and much lower at around 10ms – 20ms). In addition, while a user keeps the initiating button pressed, she can drag the current algorithm’s seed point through space, and see the extracted primitive change in real time, which often provides additional insight into the fine structure of the analyzed data.
In practice, this interactive real-time exploration paradigm has led to scientific insights that were not achieved using other visualization software (see for example here or here), and is the reason that 3D Visualizer is one of the two most popular VR applications at KeckCAVES (the other one being LiDAR Viewer).
3D Visualizer also offers non-interactive visualization algorithms, such as the volume renderer shown at the beginning of the video in Figure 1. Volume rendering visualizes 3D volumetric data by rendering the entire function F(p) as a semi-transparent “gel,” assigning colors and transparency values to every point p based on the function value F(p) at that point, and a so-called “transfer function” or “color map.” Users are still able to interactively manipulate the volume rendering after it has been created, by changing the mapping from data values to colors and transparencies through a color map editor GUI widget.
Another neat feature of 3D Visualizer is its support for tele-collaborative analysis of 3D data sets using Vrui’s collaboration infrastructure. Multiple scientists at different locations, each using their own VR environment, can come together in a shared virtual space and interactively explore a data set together. Visualization primitives extracted by any user are sent to all other users in real-time, even during dragging operations. Users can talk to each other via 3D spatial audio, and can see each other interacting with the data via pseudo-holographic 3D video avatars (see Figure 4).
Figure 4: A joint tele-collaborative data analysis session between a CAVE and a head-tracked 3D TV with a 6-DOF tracked input device. Remote users are represented as pseudo-holographic 3D video avatars captured by one or more 3D cameras, such as Microsoft’s Kinect, at each site. This video was recorded by a third user sitting at a regular desktop computer.
In closing: why did I choose a medical data set for the video in Figure 1, instead of Earth or physical science data sets more commonly used at KeckCAVES? Primarily because medical images, especially those showing gnarly trauma, are more relatable to a non-expert audience, and secondarily, because our efforts to reach out to medical professionals or researchers have not borne fruit so far, and I was hoping that this video might help with that. We have shown 3D Visualizer to a number of surgeons, from our own med school or other places, using actual patient data they brought with them, and while the surgeons have always been enthusiastic about the ability to work directly and intuitively with imaging data, it has never led to an actual collaboration, or the installation of VR systems in hospitals. We did install a (then) low-cost VR system based on a 3D TV at our med school a number of years ago, but that was for a different purpose, and it is not currently being used to look at 3D medical images in a clinical setting.
