The most interesting aspect of this talk, for me, was that the art project and all the software development for it, are done by the “other” part of the KeckCAVES project, the more mathematically/complex systems-aligned cluster around Jim Crutchfield of UC Davis‘ Complexity Sciences Center and his post-docs and graduate students. In practice, this means that I saw some of the software for the first time, and also heard about some problems the developers ran into that I was completely unaware of. This is interesting because it means that the Vrui VR toolkit, on which all this software is based, is maturing from a private pet project to something that’s actually being used by parties who are not directly collaborating with me.
The original stereo projection system, driven by a 2006 Mac Pro, was getting long in the tooth, and in the process of upgrading to higher-resolution and brighter projectors, we finally convinced the powers-that-be to get a top-of-the line Linux PC instead of yet another Mac (for significant savings, one might add). While the Ubuntu OS and Vrui application set had already been pre-installed by KeckCAVES staff in the home office, I still had to go up to the lake to configure the operating system and Vrui to render to the new projectors, update all Vrui software, align the projectors, and train the local docents in using Linux and the new Vrui application versions.
I’ve recentlyrealized that I should urgently write about LiDAR Viewer, a Vrui-based interactive visualization application for massive-scale LiDAR (Light Detection and Ranging, essentially 3D laser scanning writ large) data.
Figure 1: Photo of a user viewing, and extracting features from, an aerial LiDAR scan of the Cosumnes River area in central California in a CAVE.
I’ve also realized, after going to the ILMF ’13 meeting, that I need to make a new video about LiDAR Viewer, demonstrating the rendering capabilities of the current and upcoming versions. This occurred to me when the movie I showed during my talk had a copyright notice from 2006(!) on it.
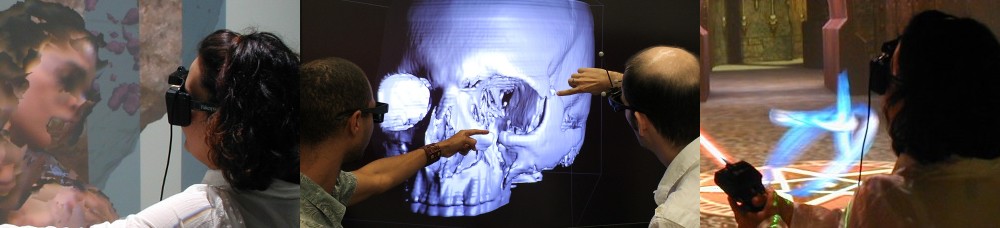
Now here’s some good news: I mentioned recently that reports of VR’s death are greatly exaggerated, and now I am happy to announce that researchers with the Institute of Cybernetics at Tallinn University of Technology have constructed the country’s first immersive display system, and I’m prowd to say it’s powered by the Vrui toolkit. The three-screen, back-projected display was entirely designed and built in-house. Its main designers, PhD student Emiliano Pastorelli and his advisor Heiko Herrmann, kindly sent several diagrams and pictures, see Figures 1, 2, 3, and 4.
Figure 1: Engineering diagram of Tallinn University of Technology’s new VR display, provided by Emiliano Pastorelli.
Figure 1: A marketing image for the zSpace holographic display. Image taken from http://zspace.com.
I’ve been waiting for this for such a long time: a turn-key stereoscopic display with built-in pre-calibrated head tracking and tracked input device. We’ve been in the low-cost VR business for more than four years now, but the biggest problem is that our reference design is entirely DIY. Users have to go out and buy individual components, assemble them, and then — most importantly — calibrate them with respect to each other. This calibration step is the biggest hurdle for low-cost VR’s acceptance, because the idea behind it is somewhat hard to understand for VR non-experts, and even if it’s understood, it still requires expensive non-standard tools.
The solution, of course, is simple: instead of having the display and tracking system as separate entities that need to be calibrated with respect to each other, integrate them into the same frame, and pre-calibrate them at the factory. The only thing that had to happen was for a manufacturer to step up to the plate and make it so.
Intrinsic camera calibration, as I explained in a previous post, calculates the projection parameters of a single Kinect camera. This is sufficient to reconstruct color-mapped 3D geometry in a precise physical coordinate system from a single Kinect device. Specifically, after intrinsic calibration, the Kinect reconstructs geometry in camera-fixed Cartesian space. This means that, looking along the Kinect’s viewing direction, the X axis points to the right, the Y axis points up, and the negative Z axis points along the viewing direction (see Figure 1). The measurement unit for this coordinate system is centimeters.
Figure 1: Kinect’s camera-relative coordinate system after intrinsic calibration. Looking along the viewing direction, the X axis points to the right, the Y axis points up, and the Z axis points against the viewing direction. The unit of measurement is centimeters.
What I haven’t mentioned before is that we have an even lower-cost, and, more importantly, easier to install, alternative using just a 3D TV and a Razer Hydra gaming input device. These environments are not holographic because they don’t have head tracking, but they are still very usable for a large variety of 3D applications. We have several of these systems in production use, and demonstrated them to the public twice, in our booth at the 2011 and 2012 AGU fall meetings. What we found there is that the environments are very easy to use; random visitors walking into our booth and picking up the controllers were able to control fairly complex software in a matter of minutes.
A user controlling a low-cost 3D display (running the Nanotech Construction Kit) with a Razer Hydra 6-DOF tracked input device.
ShowEarthModel is one of the example programs shipped with the Vrui VR development toolkit. It draws a simple texture-mapped virtual globe, and can be used to visualize global geophysical data sets — specifically those containing subsurface data, as the globe can be drawn transparently. However, ShowEarthModel is not packaged with any data sets, primarily to keep the download size small, but also for licensing reasons. Out of the box, it only contains a fairly low-resolution color-mapped Earth topography texture (which can be changed, but that’s a topic for another post).
Since it’s one of the most common requests, here are the steps to download up-to-date earthquake data from the ANSS online catalog:
We are currently involved in an NSF-funded project to study the changes in global ocean flow patterns in response to past climate change, specifically the difference in flow patterns between the last glacial maximum (otherwise known as the “Ice Age”, ~25000 years ago) and the Holocene (otherwise known as “today”).
In layman’s terms, the basic idea is to use differences in the chemical composition, particularly the abundance of isotopes of carbon (13C) and oxygen (18O), of benthiccore samples collected from the ocean floor all around the world to establish correlations between sampling sites, and from that derive a global flow model that best explains these correlations. (By the way, 13C is not the carbon isotope used in radiocarbon dating; that honor goes to 14C).
This is a multi-institution collaborative project. The core sample isotope ratios are collected and collated by Lorraine Lisiecki and her graduate students at UC Santa Barbara, and the mathematical method to reconstruct flow patterns based on those samples is developed by Jake Gebbie at Woods Hole Oceanographic Institution. Howard Spero at UC Davis is the overall principal investigator of the project, and UC Davis’ contribution is visualization and analysis software, building on the strengths of the KeckCAVES project. I’ve posted previously about our efforts to construct low-cost immersive display systems at our collaborators’ sites so that they can use the visualization software developed by us in its native habitat, and also collaborate with us and each other remotely in real-time using Vrui’s collaboration infrastructure.
So here is the first major piece of visualization software developed specifically for this project. It was developed by Rolf Westerteiger, a visiting PhD student from Germany, based on the Vrui VR toolkit. Here is Rolf himself, using his application in the CAVE:
PhD student Rolf Westerteiger using his immersive visualization application in the KeckCAVES CAVE.
This application reads a database of core sample compositions created by Lorraine Lisiecki, and a reconstructed 3D flow field created by Jake Gebbie, and puts both into a global three-dimensional context. The software shows a block model of the Earth’s global ocean floor (at the same resolution as the 3D flow field, and vertically exaggerated by a significant factor), and allows a user to interactively query and explore the 3D flow.
The primary flow visualization method is line integral convolution (LIC), which creates dense and intuitive visualizations of complex flows. As LIC works best when applied to 2D surfaces instead of 3D volumes, Rolf’s application is based on a set of interactively controllable surfaces (one sphere of constant depth, two cones of constant latitude, two semicircles of constant longitude) which slice through the implicitly-defined 3D LIC volume. To indicate flow direction, the LIC texture is animated by cycling through a phase offset, and color-coded by either flow velocity or water temperature.
The special thing about this LIC visualization is that the LIC textures are not pre-computed, but generated in real time using the GPU and a set of GLSL shaders. This allows for even more interactive exploration than shown in this first result; a user could specify arbitrary slicing surfaces using tracked 3D input devices, and see the LIC pattern displayed on those surfaces immediately. From our experience with the 3D Visualizer software, which is based on very similar principles, we believe that this will lead to a very powerful exploratory tool.
A secondary flow visualization method are tracer particles, which can be injected into the global ocean at arbitrary positions using a tracked 3D input device, and leave behind a trail of their past positions. Together, these two methods provide rich insight into the structure of these reconstructed flows, and especially their evolution over geologic time.
A third visualization method is used to put the raw data that were used to create the flow models into context. A set of labels, one for each core sample in the database, and each showing the relative abundance of the important isotope ratios, are mapped onto the virtual globe at their proper positions to enable visual inspection of the flow reconstruction method.
Unfortunately, Rolf had to return to Germany before we were able to film a video showing off all features of his visualization application, so I had to make a video with myself standing in for him:
The next development steps are to replace the ocean floor block model read from the flow file with a high-resolution bathymetry model (see below), and to integrate the visualization application with Vrui’s remote collaboration infrastructure such that it can be used by all collaborators for virtual joint data exploration sessions.
Global high-resolution bathymetry model at 75x vertical exaggeration. View is centered on Northern Atlantic.